
图像特征匹配
模板匹配、特征点匹配、相位法
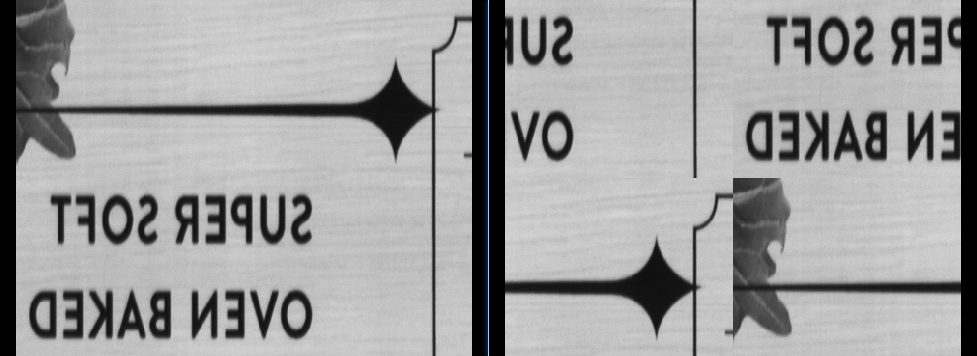
一、模板匹配
二、 特征点匹配
特征点检测:SIFT、ORB、SURF
- SIFT(尺度不变):精度高,计算量大。
- ORB(二进制):速度快,适合实时应用。
- SURF(加速版SIFT):平衡速度与精度。
匹配方法:暴力匹配、FLANN
- 暴力匹配(Brute-Force):逐对比较,精度高但速度慢。
- FLANN(近似最近邻):适合大规模数据,需根据描述子类型调整参数(如KD树用于浮点,LSH用于二进制)。
SIFT描述子是基于梯度的方向直方图,而ORB用的是二进制描述子,比如BRIEF。二进制描述子的优势是计算速度快,因为比较的是二进制位的差异,可以用汉明距离来衡量相似性。而像SIFT这样的浮点型描述子,则用欧氏距离。这可能影响匹配的速度和准确性。
三、相位法
两幅图像在空域的平移对应频域的相位差,通过计算两幅傅里叶图像的互功率谱(Cross Power Spectrum),相位差会表现为一个脉冲峰值,其位置即为位移量。
输入2张刚性平移的图像:
输出偏移坐标:(-0.27,4.89)
WIKI解释:https://en.wikipedia.org/wiki/Phase_correlation
CV源码分析phasecorr.cpp
1 | cv::Point2d cv::phaseCorrelate(InputArray _src1, InputArray _src2, InputArray _window, double* response) |
注意上述源码中的fftShift(C); // shift the energy to the center of the frame.,同时也在halcon
demo(phase_correlation_fft)中发现对反傅里叶变换之后的图像进行平移cyclic_shift_image,略有困惑对其展开分析
平移前后对比度(对角线上的像素区域互换了)
halcon解释cyclic shift image做的原因: Since the phase correlation is cyclic, negative translations result in peaks in lower or right part of the image. If the translation is close 0 in one or two directions, the interpolation in local_max_sub_pix would therefore access wrong values because of its border treatment (which is not cyclic). To obtain a translation that is correct in all cases, we shift the phase correlation cyclically so that a zero translation corresponds to the center of the image. We then correct the coordinates returned by local_max_sub_pix.
1. 相位相关的循环性
相位相关法通过傅里叶变换计算图像的平移量。由于傅里叶变换的周期性,相位相关结果(峰值位置)是循环的。例如:
- 负平移(如向左或向上移动)会表现为峰值出现在图像的右侧或底部(即循环移位后的等效位置)。
- 零平移对应的峰值本应在原点(如左上角),但直接处理可能导致边界问题。
2. local_max_sub_pix的边界问题
local_max_sub_pix用于亚像素级峰值定位,但其默认的边界处理方式(如补零或镜像)不是循环的。当峰值靠近图像边缘时(如平移接近0),插值会访问无效的边界外像素,导致错误。
3. Halcon的解决方案:循环移位相位相关图
- 步骤1:将相位相关结果循环移位
将零平移对应的峰值从原点(如左上角)移到图像中心。例如,通过
fftshift操作,使得零平移的峰值位于(width/2, height/2)。 - 步骤2:在移位后的图中定位峰值
此时,无论实际平移是正负,峰值都会远离边缘。例如,平移
(-10, -5)的峰值会出现在中心附近的(width/2-10, height/2-5),而非靠近边界的(width-10, height-5)。 - 步骤3:修正坐标
将
local_max_sub_pix返回的中心坐标系下的峰值坐标,转换为原始坐标系下的实际平移量。例如,若中心为(Cx, Cy),找到的峰值为(Px, Py),实际平移为(Px - Cx, Py - Cy)。
4. 关键操作示例
假设图像尺寸为512x512:
- 原始相位相关图:零平移峰值在
(0,0)。 - 循环移位后:零平移峰值移至中心
(256,256)。 - 平移
(-10, -5)的峰值:移位后位于(256-10, 256-5) = (246,251)。 - 修正坐标:平移量为
(246-256, 251-256) = (-10, -5)。
5. 总结
- 循环移位:避免峰值靠近边界,确保插值有效。
- 坐标修正:将中心坐标系转换回实际平移量。
通过这种方式,Halcon确保了在所有情况下(包括零平移附近)都能正确计算平移量。
时效性:50*50:3ms i7-9700k
 wechat
 alipay